Quantcast
Channel: Best Way To Understand BI and Data Visualization And How Everything Works Here
Viewing all 60 articles
Browse latest View live

How to report data dynamically based on user's personal time zone setting -- Part 2

$
0
0

The previous entry has concluded the problem with implementing reports based on different time zone, this time we will proceed with the possible workaround.

One thing we have realized is that, the time stamp being displayed on the report is changing according to the user locale, this means it occurs per user session. We definitely should take advantage of such feature, now we have to figure out a way to capture the time zone offset value for each user locale setting and use that to do our data conversion.

Luckily, OBIEE provides a list of pre-determined system variables. A lot of you may already be familiar with the likes of 'current_date', which returns the current time stamp. Here are a few other variables familiarly for the time zone locales:


So, let's try using 'timeZone' variable and see what I can get out of it. The proper syntax for calling this variable is '@{session.timeZone}', which can be used in column formula, filter values and prompts. Now I am just creating a new column in the report with this variable, it should return the time zone name in text format, the values will be exactly what you choose in your locale drop down list.


My idea is that, since most of the locale names are in text format and it tells you the offset values such as '(GMT-07:00) Arizona', I will then just take this value and substring it so it will only have the part after '-0' and be 3 digit long, and then convert the result into integer. I then get my offset values. The good thing about this is that, the value changes dynamically based on user's locale setting. I save myself from having to mess with session authentication. The only though, is that there are 2 locales names: '(GMT) Casablanca, Monrovia' and '(GMT) Greenwhich Mean Time: Dublin, Edinburgh, Lisbon, London' do not have any numeric implications. In these 2 cases, I will just change the text 'GMT' to 'GMT +00:00' with a case statement.

So putting all these thoughts together into a formula, I then create a new column that returns the offset value with the following statement:

cast(Substring(case when '@{session.timeZone}' = '(GMT) Casablanca, Monrovia' then '(GMT+00:00) Casablanca, Monrovia' when '@{session.timeZone}' = '(GMT) Greenwhich Mean Time: Dublin, Edinburgh, Lisbon, London' then '(GMT+00:00) Greenwhich Mean Time: Dublin, Edinburgh, Lisbon, London' when '@{session.timeZone}' = '' then '(GMT+00:00) Default' else '@{session.timeZone}' end From 5 for 3) as int)


Now the latter part '@{session.timeZone}' = '' then '(GMT+00:00) Default' was simply my attempt trying to take into consideration when user locale is set 'Default'. This however, has been proven to not work. But for now, leave it as it is.

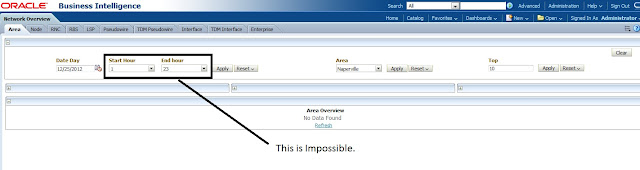
Moving on, let's set the locale to be Arizona time:


And run the report:


As you can see, now the offset values and time zone columns are both reflecting what the time zone locale should be..In my case, the offset value is -7.

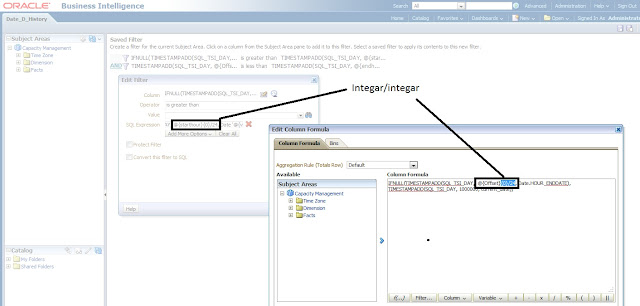
So I need to apply this offset value into my date and hour filters in order to take Arizona time into consideration. In my case, it is to edit the filter column formula where the original number divided by 24 would be replaced by the offset value. From the below screenshot, you will see a big cast statement divided by 24 within the timestampadd function. The exact reason of such set up can be read here if you care, but I digress. 


Like I said from the previous post, this is a workaround, which doesn't quiet get it at 100%. One of the main issue of this solution is that it doesn't take daylight saving changes into consideration. This can be a big problem in the long run as daylight saving is one of the most complex thing to tackle. Nevertheless, having timeZone session variable is really handy, it opens more possibilities. Now with the tools we have, I am exploring into other solutions that might be able to deal with this requirement more efficiently. 

I think I have found one! My first round of testing looks very promising.


Stay tuned!


Until next time

How to report data dynamically based on user's personal time zone setting -- Part 3

$
0
0

So from the last time I took a step further to solve the issue of reporting based on time zone, although it wasn't 100% correct, at least it opens up a few options. The conclusion there was that we need to find a way to dynamically choose the time zone offset value and use it for our time conversation. Where I was stuck was at the daylight saving changes that happens from all over the world.

Therefore, I have decided to introduce a time zone table that stores all of the time zone and the corresponding offset value. The table structure is like below, and I have manually added 2 rows, both are for GMT -6 time zone. However, one of the time zone is currently having DST in effect while the other doesn't:


Then, bring this table into OBIEE's model:


Now, let's create some dashboard prompts using these 2 columns:


Here on Time Zone prompt, I am applying the following expression to show the contend:

SELECT case when "Time Zone"."Time Zone" = '@{session.timeZone}' then "Time Zone"."Time Zone" end FROM "Capacity Management" where case when "Time Zone"."Time Zone" = '@{session.timeZone}' then "Time Zone"."Time Zone" end is not null

The previously discovered session variable 'timeZone' is truly handy here. So the idea is that, when the time zone column equals the locale name that's generated by user session, it will return that exact locale name which is also stored in the time zone table. The where clause eliminates all the other records which will be null in this case. Also, the default value of this prompt will be the session variable.

Now create the second prompt on offset value:


Now the second prompt is also coming from the same time zone table, this should record the offset value that matches the locale name in the table. To do some, in the 'SQL result' setting, I entered the following expression:

SELECT "Time Zone"."Offset Value" FROM "Time Zone" where  "Time Zone"."Time Zone" = '@{session.timeZone}'

Also, I have set a presentation variable which will pass this value into any filters or tables that need conversions. I call this variable 'Offset'.

So let's test this prompt on the dashboard with the first locale setting, which is central America time:


The result looks great. These fields are automatically populated.

Now change the locale setting to central time U.S & Canada:


Then refresh the log in again and we see it automatically updates:


Now, the rest is pretty straightforward.  Remember in my previous post where I was forced to use the following expression to convert my time stamp in my timestampadd function? 

Timestampadd(sql_tsi_day, cast(Substring(case when '@{session.timeZone}' = '(GMT) Casablanca, Monrovia' then '(GMT+00:00) Casablanca, Monrovia' when '@{session.timeZone}' = '(GMT) Greenwhich Mean Time: Dublin, Edinburgh, Lisbon, London' then '(GMT+00:00) Greenwhich Mean Time: Dublin, Edinburgh, Lisbon, London' when '@{session.timeZone}' = '' then '(GMT+00:00) Default' else '@{session.timeZone}' end From 5 for 3) as int)/24 , Date."Hour Date"

Now I can simply replace all these codes to the following:

Timestampadd(sql_tsi_day, @{offset}/24 , Date."Hour Date". 

This will take care of all scenarios..

From OBIEE's point of view, we are all done. So of course, we have to maintain our time zone table and we have to figure out what offset value is for each time zone and when is their DST start and end date of the year. I went to wikipedia and it was pretty eye opening and fun to learn all these stuffs. 

So then, I will load the entire table with all of the time zone name and offset values. Some script will have to be called on specific day to update the offset value for DST. Although this may sound complicated, it is not in real life. Think about this, most of the time we will be supporting business in Asia, Europe, North America, South America or Africa.. A lot of those time zones never observe or no longer observe DST. The main countries that do are in Europe or North America, and most of their DST period are from March to Oct or April to Nov. Then we have a few exceptions in Australia, even then, there aren't that many to deal with. Most of the time, we won't cover them all unless your BI Platform is so big that it truly need to cover users from Marshall islands, Baghdad or New Guinea, which I highly doubt. I would say, this approach takes care of most cases and should be a good solution..

Thanks, until next time 


OBIEE The application of creating sub-report to filter another report

$
0
0
Hello guy

In the creation of OBIEE, we all know that we can use 1 report's result set as filter condition for another report. This is called sub-report, the equivalent SQL statements from the log is then nested query. Today, I want to talk about 1 good situation where this technique can be very helpful.

Now look at the below report. This report provides a lot of PWE ID from the left.


Now, I want to create another report, the second report should only show the  PWE ID that are related to the ones from the first report when user specifies any PWE from the prompt. In other words, when user pick PWE '10083_HSPA_CD_100005', then the first report will return only for that PWE, but the second report that we are about to create should return for '10083_HSPA_CD_100006' instead of '10083_HSPA_CD_100005' because according to our rules, they are related.

So this is a perfect example of using sub-report, knowing the relation is obtained based on the prefix of the PWEs up to the last '_'. In other words, if the prefix before the last 6 digits are the same, they are related.

Subsequently, we will go back to the first report and add a new column called 'initial' with the following expression:
SUBSTRING(Pseudowire."PWE ID",1, (LENgth(Pseudowire."PWE ID")-6))

This substrings the text from '1' position, and it will go for whatever length of the text up to the last 6 digits. So in our case, the last 6 digits of each row will be chopped off:


Now let's start with the second report by adding all of the wanted fields including 'initial' with the same above expression:


Now that we have the second report which we call 'related Pseudowires', we will then start creating filters for this report. The idea is the take the column 'initial' from this report, and match it up with the same column from the first report with 'equal' operator. In this case, the second report has to return the PWE that belongs to the same initial as determined from the first report.  Then we will nest the report again by creating another filter on PWE ID. This time, PWE ID from the second report show NOT equal to the PWE ID from the first report. So when both conditions are satisfied, the only record that will come back from the second report will be the related PWE.


Now, put these reports on the dashboard. As an option, I can also define a guided navigation for section 2 where second is held. The guided navigation will act as a condition that when the second report returns at least 1 row, it will appear on the dashboard, otherwise, it's hidden.


Now, let's see how this works on the dashboard. First we don't specify the prompt value. So the first report comes back with all PWEs and second report is nowhere to be seen:


Now, select 1 PWE from the prompt and rerun the dashboard:


Now the second report appears, but it is displaying only the related PWE from the first report.

Thanks,

Until next time.

Basic External table authentication with password encription

$
0
0
Hello

Today, I want to talk about some real basic stuff in OBIEE 10G, which is external table authentication. I know there are many similar posts out there on the internet, I still want to post my own version. This is not to show off or anything, just so I don't have to memorize these things in the future if the article is kept in my own space. I know that we are talking about 11G nowadays, everybody is talking about cool things they can do with 11G, google maps, unstructured data and so on. I like to get into those things too, in fact I have. But I still believe that the understanding of basic security approach in OBIEE, the usages of session variables, the standard process of user management can benefit in the long run.

So without further digression, the external table authentication is a way to manage users and user groups in an external DB table for OBIEE to authenticate user's accessibility to the application. LDAP Authentication on the other hand, is to store user information in LDAP server. For external table authentication, the definition of the table isn't always the same from company to company. But the basics are the same. You typically will have 3 tables:

First one is user table that stores user ID and other user Infos;


second one is user group table that stores user group information:


Now because 1 user can belong to many groups and 1 group can have many users, they naturally form n:n relationship. Therefore, we have a third table which map each user to user group:


Now that we have the structures ready, we will implement external table authentication in OBIEE by creating session variables. My first initialization block is 'Isauthentication' which is associated to several session variables:
User
Displayname
Loglevel
Email
Password

The follow screenshot is misleading, it should've been printed 'create 5 session variables for this block':


The initialization string for this block is:
(The bold text are the variable names with just created)


select USERNAME, DISPLAYNAME, LOGLEVEL, EMAIL,PASSWORD from IS_SEC_USER
where UPPER(USERNAME) = UPPER(':USER') and PASSWORD =  IS_GET_MD5_VAL(':PASSWORD')

This query basically goes into user table and find all of the record where column 'username' = the value of 'USER' variable and column Password = the value of the 'PASSWORD' variable.  Due to the nature of session variable, these values will be assigned when user initiates a session by attempting to log in.  The test result of this initialization block is shown:


Now what is 'IS_GET_MD5_VAL'? It is a DB function that encrypts the password in user table:

This is just an fyi, you don't have to bother about it:


create or replace FUNCTION IS_GET_MD5_VAL (p_in VARCHAR2)
   RETURN VARCHAR2
IS
   l_hash   VARCHAR2 (2000);
BEGIN
   l_hash :=RAWTOHEX(UTL_RAW.cast_to_raw(DBMS_OBFUSCATION_TOOLKIT.md5 (input_string=> p_in)));
   RETURN l_hash;
END;

So the password in the user table looks like this:


 Anyways, let's move on to the next initialization block that we will create, which in my case is authorization.
The purpose of this is to get all of the user groups that the users belong to. The previous initialization block gets the users from user table, therefore, it should take precedence over this one.

Note the row-wise initialization is needed here. It will return all of the rows that the user belong to, instead of a single value, which variable typically does.


The initialization string is this:


ISAuthorization= select 'GROUP', UG.GROUPNAME from IS_SEC_USER_USERGROUPS FFF, IS_SEC_USER U, IS_SEC_USERGROUP UG where
UG.ID = FFF.USERGROUPS and
U.ID = FFF.IS_SEC_USER and
UPPER(U.USERNAME) = UPPER(':USER')

This is clear that this query joins all of the 3 tables and find the right group that any user belong to. This is executed after the previous initialization block.

So the idea here is that when users log on, the first session will get the user's ID and password from user table if it exist, then it will join to the group table and find out what are all of the groups this user belong to. So not only user is able to log into OBIEE, but also it's privilege will also be defined based on the group privilege. We can define user/group privilege in OBIEE later.

So from previous screenshot we know there is a dummy user call 'Admin', although the password shown in the table is encrypted, but we created its password to be 'Admin'.

Now lets log on to OBIEE via Admin/Admin:


Now the result is:


Thanks

Until next time

a general approach to performance tuning in OBIEE

$
0
0
A long time ago, I wrote an article about performance tuning in OBIEE, in which I stated the importance of minimizing performance issue by having a good project direction and a clear understanding of the BI Concept. This is the ensure the project with clean design, optimized process so that we won't even running into a lot of the performance issues later on. Remember, a bad design, wrong process and mismanaged expectation are the root cause of a lot of the issues we potentially face on our path. Applying fixes, workaround and changes attempting the improve the performance are only temporary solutions that eases the symptom, but it won't help in the long run.

Although I am a strong believer of dealing with performance issue at design and project process level, it doesn't mean that there is nothing else we can do within OBIEE to optimize the performance. When a report is running very slow, there are a few areas in OBIEE that we can look into to diagnose the issue.

One of the most common place to investigate is the query log, which records the exact physical queries that a particular report is generating. When you look into the query log, don't just focus on the physical SQL, but also read the steps this log is recording. Each step of the action has a time stamp telling us what time this action started and what time it completed and moved on to the next step. Sometimes, it could be the connection to the DB that takes unusually long, not the query itself. Sometimes, we are defining some DB scripts in the connection pool for it to execute before or after queries, this can cause extra delay. So we need to look into all these things before getting to the physical query itself.

In order to tune a query, some basic understanding of our tables and objects are very important. We know that most of the queries consist of some dimension and fact tables. Fact tables are generally huge because it holds time sensitive information. All these stats, measures and keys are subject to change based on time. When you look at sales fact, you don't just look at the sales total, you need to look at sales total based on dimensional information, especially time related information in order for it to make sense. Therefore, fact tables are loaded with a certain frequency based on time, the records can be at hourly frequency or daily frequency or even min frequency. Over time, fact tables get huge. A full table scan on a fact table will definitely be very costly and slow. Therefore, when all of the queries should at least have a day dimension joining to the fact table and filter based on a specific time period to avoid full table scan. Indexes, and partitions are always needed on the fact table. But then again, if a user insists on running a report for entire 2 years of data, then there is no much we can do. He should read the myth of performance tuning.

Another thing to look for is, if the report is created with some conditional expressions to define the column values, such as case statement, make sure in the where clause the case statement is not on the right side of the equation. For example, you may have a column like x column that gives you date based on different calendars, and then create a filter (like x column = current date) out of this column. Then the where clause would look like this: Where case when column = retail then retail date when column = fiscal then fiscal date else date end = current date. This type of query will take away the index you created on fact table because it has to go through the entire table since the value is conditional.

Explain plan is always a good place to look at in order to understand what the query is actually doing. However, if the query takes way too long to run, you may not want to join the explain plan and wait for a long time. I'd suggest to analyze the query by looking at how many tables and how many joins are involved in the report. Draw a diagram if need to. Then, start removing columns and joins one after another, then rerun the report and measure the performance. I guarantee that by removing layers and layers of joins, the performance will start to get better. Then you will be able to find that 1 table, when joined with your other tables, kills the performance. Then focus on tuning a much simpler version of the query. Chances are, you need to set the driving table to be the smaller table in your logical & complex join. Understand the sequence of how data are being fetched to make sure the smaller dataset is used as the driving dataset against much larger fact tables to avoid full table scan.

An example: You have one report that fetches data from the following tables in a snowflake fashion:

Region <--> Supplier <-->Customer <--> Sales fact<-->Date-->-->-->-->

We know that sales fact is much bigger. Region has to go through supplier in order to find customer, and then go to the sales fact to find the measures for those selected customers based on date and regions. So if I go from regions to supplier and then customer, I will obtain a pretty small list of records. Then I will just search into the sales fact for these small list of customers instead of scanning the whole fact table. Other way to get the result would be, get all of the sales fact records, then take the record and search into customer and eventually get you the region. First way is much faster then the second way because the driving data set is much smaller. The explain plan will outline the flow of the joins. Analyze that and see if you are using the wrong data set as driver.

Sometimes, graphs and charts can cost system overheads too. Putting too many charts and graphs on one dashboard will slow down the performance.

Although caching, aggregate tables are available in OBIEE as features, don't look at it as magic bullets. Especially caching, it has cost and it won't work in ad-hoc environment.

Understanding your hardware resources and system environment is another important aspect of performance tuning. You need to know where your limit is.

In summary, performance tuning is a very common practice in all OBIEE project because we all face slow performance. Certain things can be avoided by having a clean design, other issues will have to be investigated and tuned at the query and DB Level, while there are still possible solutions using OBIEE features. Still there will be some issues you just can't fix. As a last resort, a deep understanding of what the customer wants is important before you apply the workaround so that you can manage the expectation properly.

Thanks

Until next time


How to configure session time out time in OBIEE

$
0
0
Today, let's talk about something real quick and simple here. Have you ever wondered why after being idle for a while, when you resume your tasks in OBIEE, you are logged out? That's because you have wondered off for quiet sometime and the system logged you out due to inactivity. So knowing this behavior, how do we control the time that OBIEE should allow user to be idle before logging them out?

The configuration is done in instanceconfig.xml file by entering the following entries:


I have entered 60 mins here, which means the system will allow me to be idle for 60 mins before logging me out..

The place you enter these entries is shown below:


Thanks 

Until next time

OBIEE Case study --- How to ensure reporting the right data that is time sensitive part 1

$
0
0
Hello again.

Today I want to talk about a scenario we face in our project. In terms of OBIEE, we know we have to create reports and dashboards to show data. How to ensure we show the right data? Data means nothing when the concept of time is out the windows, specially when it comes to performance related data. In other words, when you are reporting your sales performance, financial performance, you always have to look at a specific time or time range in order to have the number make sense to you. How do you ensure you are getting the right data is always something we have to guarantee in our design.

Let's take the following scenario:

I have an overview dashboard that the goal is to show the list of objects or entities that I have in my system. In my case, show me a list of network devices such as LSP cables, Pseudowires, Nodes that are active within 1 day's hourly range. Then from overview dashboard, we will look at the performance of each devices by throughput, utilization and drops over a range of dates and hours.

In terms of data modeling, we will have models like the following:

Overview report queries: LSP Dim --> LSP_PWE_CONFIG_F--> Pseudowire Dim
In this case, LSP_PWE_CONFIG_F is more of an mapping table that join the 2 dimensions when they are N:N relationship.

Performance reports queries:  LSP Dim --> LSP_PWE_CONFIG_F--> Pseudowire Dim --> Pseudowire Fact

Here in this case, it is a little bit of snowflaking, but eventually we will get the throughput, Utilization of pseudowires that would add up to LSP.

So when we have this model, how are we going to check against the date dimension to ensure you have the right data?

From a developer's perspective, you don't have to worry such thing as you would pretty much do what the design document tells you. However, that would only get you this far. If you want to think beyond developers, you have to look at it from an architect's perspective. This is what I am focusing in this article. This isn't about where to click and what code to write, it is about how to make the design.

So here are a few things we have to take into consideration before making the design.

1. How often are the dimension tables updated? Does it keep history or not?

2. How often are data loaded into LSP_PWE_Config_Fact?

3. How often are data loaded into Pseudowire Fact or any performance fact?

4. What does date key in date dimension and fact table have?

In other words, you can't just blindly join the date dimension to both fact or any one of the fact table and be done with it. You have to think in terms of architect and really understand how would it work when you make that join.

Next time, we will continue on how this scenario is implemented

Until next time


OBIEE Case study --- How to ensure reporting the right data that is time sensitive part 2

$
0
0
In the previous post, I have stated the scenario and the things we have to look at before making any decisions. Knowing the right questions to ask, we get the right answers that will matter to our design.

In my case, for the 4 things I listed in the previous post, the answers are below:


1. How often are the dimension tables updated? Does it keep history or not?
--Dimensions get updated whenever there is an update. Therefore 3 columns in all dimension table, start date, end date and history. History is flag either 'Y' or 'N' to indicate whether it is still active as of the current time stamp. The history is kept and new update comes as new insert

2. How often are data loaded into LSP_PWE_Config_Fact?

The configuration data are updated once a day at 11: 00 pm. There is currently a datekey column in the fact table that gives the date and hour. However, because it is only updated once a day, so before the next update we will have datekey as ''201211112300" for all of the records.

3. How often are data loaded into Pseudowire Fact or any performance fact?

The statistic record are at hourly level. In other words, the datekey for fact table is having 1 hour increment: 201211110000, 201211110200 ...... 201211112300 etc.

4. What does date key in date dimension and fact table have?
As indicated above. The datekey in Date Dimension also contains hours.

Remember the 2 dashboard requirements I mentioned before? I will just mention it again here:


Overview report queries: LSP Dim --> LSP_PWE_CONFIG_F--> Pseudowire Dim
In this case, LSP_PWE_CONFIG_F is more of an mapping table that join the 2 dimensions when they are N:N relationship.

Performance reports queries:  LSP Dim --> LSP_PWE_CONFIG_F--> Pseudowire Dim --> Pseudowire Fact

Now how will I go above creating such reports? How would I design the data model for this?

First of all, I have to check the date against fact table to avoid full table scan, moreover, to ensure we are getting the right data at right time at the hourly or daily level, we have to join date Dimension to fact table.

What about configuration fact?

We also need to look at the date in the configuration fact table to ensure that we are picking the dimension objects that are active during the date range we pass from the filter. Does that mean we will have a model like this?


It looks like it will work but it has an issue. Suppose we have a list of LSP and Pseudowires that started on Nov 10 at 1:am, and it's never ended. The performance of these objects are constantly updated in fact table every hour and everyday. Now, the user goes into the system and select the date as Nov 11 from 5am to 7am. Fair enough, the user wants to see the performance of these objects between 5am to 7am on Nov 11th knowing that these values are recorded in the fact table.

However, based on the above model, no data will be returned, which is wrong. The reason why no data will be return is that the datekey from day dimension in this case will be 2011110500 ....2011110700, which will be passed to both LSP PWE Config fact and Pseudowire Fact. Now Pseudowire fact obviously will have data for these keys because records are updated every hour, the same won't be true for LSP PWE Config fact. Because of the fact that the data are updated once a day at 11pm, which is 23rd hour. So all of the keys in that table will be date||2300. This means, unless user's filter values includes 11pm's hour, the report will always be empty.

So how are we going to solve this problem?

There are several options we can think of from modeling's perspective. I will just list 2 here:

1. Substring the date key in LSP PWE Configuration fact so that the join will only look at the date part, but not hour part. In this case, the report will be correct since this table updates once a day

2. Add a start date, end date including time stamps and history column in the LSP PWE Config fact just like in Dimension tables. Instead of joining LSP PWE Config fact to date dimension, we will remove this join. Instead, we will use start date, end date from this table to receive filter values as well as hours. The date will be filtered based on directly passing filter values into this table, instead of through datekey.

Now obviously, the first approach sounds much easier. Yet, it has a drawback. Although it is going to work after making the change to check only date, not hours, it has a limitation. When the system decides to change the data collection frequency of this table from once a day to twice a day, this design is not going to be flexible enough to accommodate that. Because now we do need to look at hours, then what to do? From an architect's point of point, I need to take these potential changes into consideration in every design. So I can't just provide short term solutions.

Therefore, after some deliberation, I have decided to explore the second approach.

Stay tuned


Invalid state Identifier Error Code: GV3MWW29 on OBIEE Dashboard

$
0
0
Have you ever seen this error message before?


Below is what Oracle says about this error and how to fix it, the original document can be found in Oracle support metalink with the support ID: 1087513.1


Applies to:
Business Intelligence Server Enterprise Edition - Version: 10.1.3.4.0 [1900] to 11.1.1.5.0 [1308] - Release: 10g to 11g
Information in this document applies to any platform.

Symptoms
An Oracle Business Intelligence Enterprise Edition (OBIEE) 10g or 11g environment includes Microsoft IIS (version 6) and Single Sign On (SSO) with Windows Active Directory (AD).
In this environment, users login to their Windows PC via AD and the authentication details are passed directly to OBIEE so that the OBIEE login page is not displayed.
Additionally, there are no session timeouts and it is possible for users to remain logged in to their system for long periods of time (i.e. 20 hours).
If a user leaves the sessions in Presentation Services unused for a number of hours and then attempts a dashboard action, the following error occurs:

Invalid state identifier 4i2aukgvatfu0k2ifkgmt5sj3m
Error Details
Error Codes: GV3MWW29

If the browser is refreshed, or a new dashboard page is opened, the error is removed.

When this problem occurred, the saw.log showed the following errors:

Type: Error
Severity: 42
Time: Fri Jan 08 11:20:56 2010
File: project/webbedrock/binaryfile.cpp Line: 355
Properties: ThreadID-3728;HttpCommand-Dashboard;Proxy-;RemoteIP-127.0.0.1;User-;Impersonator-
Location:
saw.xmlDocumentCache.findDocument
saw.views.evc
saw.subsystem.portal
saw.httpserver.request
saw.rpc.server.responder
saw.rpc.server
saw.rpc.server.handleConnection
saw.rpc.server.dispatch
saw.threadPool
saw.threads

Path not found: C:\Oracle\OracleBIData\tmp\sawvc\10a3\4i2aukgvatfu0k2ifkgmt5sj3m.sawxd
The file specified cannot be found

---------------------------------------
Type: Error
Severity: 42
Time: Fri Jan 08 11:20:56 2010
File: project/webreport/xmlstatepool.cpp Line: 97
Properties: ThreadID-3728;HttpCommand-Dashboard;Proxy-;RemoteIP-127.0.0.1;User-;Impersonator-
Location:
saw.views.evc
saw.subsystem.portal
saw.httpserver.request
saw.rpc.server.responder
saw.rpc.server
saw.rpc.server.handleConnection
saw.rpc.server.dispatch
saw.threadPool
saw.threads

Invalid state identifier 4i2aukgvatfu0k2ifkgmt5sj3m

Cause
Invalid state error occurred due to inconsistency between OBIEE server tmp files and SSO environment.
When a user connects to a dashboard, OBIEE creates TEMP files to maintain the state information of the dashboard. These files are stored in the ${OracleBIData}/web/tmp directory.

OBIEE also has a number of internal functions/jobs that clear up what it determines are stale sessions and TEMP files when the server is not busy.

In this situation, the internal job performing the cleanup removed the TEMP files as it determined the sessions were stale as they had been left for so long.
The TMP file being removed is evidenced in the saw.log:

Path not found: C:\Oracle\OracleBIData\tmp\sawvc\10a3\4i2aukgvatfu0k2ifkgmt5sj3m.sawxd
The file specified cannot be found
....
Invalid state identifier 4i2aukgvatfu0k2ifkgmt5sj3m
Solution
Please do the following to prevent this error from occurring:

Set the following parameters in the ${OracleBIData}\web\config\instanceconfig.xml file:

1440
1440
The above parameters (1440 minutes) will prevent the .sawxd files from being removed after 24 hours of idle times.
You may set the values higher (i.e. greater than 24 hours) if needed, but this is not recommended.
Setting the memory expire and disk cleanup interval to high values increases the number of sessions on the server.  If a significant number of idle sessions linger on the server, it will increase resource utilization and may lead to performance problems.

References
BUG:7244734 - INTERMITTENT INVALID STATE IDENTIFIER ERRORS ON DASHBOARD
BUG:9374127 - ERROR IN BROWSER - ERROR CODES: GV3MWW29
NOTE:563079.1 - Analytics Logout on integrated Env with SSO

OBIEE Case study --- How to ensure reporting the right data that is time sensitive part 3

$
0
0
The second approach that I talked about earlier was about adding the history records into some of the fact tables that are updating at daily level. That means the below model will have to change


To this:


From OBIEE side, we remove the join between Date and LSP PWE Config fact, and snowflake the model in BMM Layer. From the reporting side, we will have 2 filters:

1. Date = date prompt value and hour = hour prompt value (These values will come from presentation variables) or Date is between date prompt values

2. LSP PWE Config start date < = date prompt value and end date > = date prompt value. This ensures only the 'current' record from this table will be returned at any chosen date in the past or present.

One thing to keep in mind is that, when it comes to reporting the historical trend or plotting the performance overtime, the second filter will have to change, here is why:

When user are selecting a range of days, such as date is between Nov 1st to Nov 20th and let's say we do have data in the Pseudowire fact table from these days, we are going to display the results correctly. Lets say all of the records in LSP PWE Config fact and other dimension tables also start on Nov 1st and no end date,  the report is working fine. However, when user select from Oct 31st to Nov 20th, they would naturally expect the same result even if nothing occurs on Oct 31th. However, the report will go blank because the second filter won't work here. On Oct 31th, there is no record is nothing was ''Current" at that time.

In order to fix it, we will then have to change the second filter to go between the day range. Which means:

2. LSP PWE Config start date >= date prompt value and end date <= date prompt value. This ensures only the 'current' record from this table will be returned at any chosen date in the past or present.

Thanks

Until next time

OBIEE 10g to 11g upgrade challenge ---dealing with unexpected floor function

$
0
0
Hello all

It's been a little while since I posted. I was busy re-platforming and upgrading all of our BI system to 11g. They was a lot of work but it was fun and challenging. Moreover, there was a lot of lessons learned from that, which I will post in detail later on. Today, I just want to share something real quick.

One of the thing I immediately noticed after upgrading to 11g was that all of my reports stopped working on the dashboard when passing through dates and hours from the prompt. Let me illustrate what I mean here.


The below report is showing records for every hour of the day and the hour prompts are not selected to begin with.


Now I put 1 and 23 in my prompt and the report returns nothing. Later on, I tried different number ranges, from 1 to 3 or from 10 to 11, the report never came back with data, it is impossible as I do have data for those hours.


For those who are curious about this set up, you can find it here and here too as I implemented this along with time zone conversation back in 10g:

In my other system, this report is still working fine as it is in 10G environment.


So what's going on? How do you begin solving this mystery?

This is when analyzing the physical SQL queries generated in the 2 applications becomes crucial. I generated both SQLs, and I ran both against the DB that 11G is connected to. I found out that both SQLs work perfectly and correctly in the DB. However, when I changed the prompt values in 11g to match the criteria of the working report in 10g and re-evaluated the SQL, i saw something interesting.


In the 11g SQL, in part where the filter is applied, I noticed 'floor' function being used here. At the same time in the SQL generated from 10g for the same logic, the SQL doesn't have 'floor' function. It was just doing a simple division:


Upon some research, I came across that in 11g, the BI server automatically issues floor function when 2 integers are dividing each other.

This makes sense now as all of my filter logic are based on hour divided by 24. The reason was complex, if you are interested, you can read about it here (It can be valuable for those who are struggling with performance). Anyways, it is what it is and knowing that floor function happens when 2 integers divide, so we have to think of a work-around.

Floor function can be unsupported if you wish to uncheck the DB feature of that in the RPD, but I wouldn't just go for that, because you never know in the future you may need it.

Knowing the problem and the future of my set up, I have decided to change the formulas and coding of my filters to avoid integers dividing each other:

As you can see from below, these old codes in 10g are diving integers. So I am going to replace 24 (highlighted) to 24.00 to all that applies. This should automatically fool OBIEE into not using floor function.


Now, let's test again.

Working perfect now!


Great, one of the many problems from upgrade has been resolved, now on to the next one.

Stay tuned and happy holiday!


Redesigning Dashboards for slicker visuals and better performance

$
0
0
So you may or may not have encountered a dashboard with way too many charts and reports. This is fairly common in a lot of projects. If people aren't sure about what they want, they might as well put them all on the page. The look and feel might attract certain audience because there are different charts, different shapes and colors on one page. However, there can be problems as well. One of the thing to remember is that if 1 dashboard page has too many reports, them it will generate a lot of SQL queries every time an user visits this page. Multiplies that by 20 and another 20 and another 20 depending on how many dashboards are like that and how many users are going there for how oftenly, this can become a problem. Also if the user ever increase the time period of the dashboard and start plotting more dots on the charts, it can overload the graphing engine and create problems if all of the charts are running at the same time. The dashboard below can be a typical example (I only have a screen shot of the pdf version):


So now, how are we going to reinvent this dashboard so it will look better and it will perform better? This is the question that requires a little bit of high level visualization. You as a developer who is getting so used to reading the requirement from someone else, for once in your life need to step out of that box, and start thinking on our own. There is no such thing as right or wrong, it's more about redesigning your work for the better. Now you are an artistic person, your right brain is going to help a lot (or your left brain.. My right or your left?)

As for me, i thought the views that Iphone provides for weather display is a very slick view. You don't start by showing everything, but instead you get a 7-day overview. Once you touch-screen the day, it displays the detail weather forecast each hour of that day. Similar to the view below (Am I right fellow Iphone users?):


So what can I do to design a dashboard in OBIEE 11G that looks similar to that?

Upon some research, trials and errors, I can't really make it look like that as of yet. But I have been able to re-arrange the dashboard layouts without having to make huge changes to the existing setups. I am pretty happy with the result as it is getting better and performance efficient compared to before. There are more potentials for improvement, which I will get into later. But for now, I will show you what I have done.

1. Before doing anything, first visualize how you want to break down the existing dashboard components. Knowing that there are 12 reports in my dashboard, I have found that these reports can be put into 4 categories based on the content. So in my heart, I have come up with the names of these 4 groups.

2. In order to have the dashboard display to work similar like that of Iphone, you pretty much have not a lot of choices here. The weather on the screen is almost working similarly to that of the dashboard prompt, which passes the values to its content and displays accordingly. So I have to create a new dashboard prompt that holds 4 options which represents 4 groups names in the drop down list.

To do so, I am setting the display value to be SQL and I entered a code that unions 4 separate select statements with different group name in there.

Also, setting a presentation variable will be important. In my case, it is named "select"


3. Create 4 different reports (or analysis), each one is hard coded with the value of the group name I create in step 1:

This is the first report of the 4, and I am entering 'Node CPU & Memory' there. So this report will always have 1 record, which is 'Node CPU & Memory'. The filter is applied with the presentation variable 'select'.

So by default, this report will be empty because I set the default value of the variable to be 'none', which won't match with the data 'Node CPU & Memory' that I entered.  In other words, this report will only return 1 raw when the value 'Node CPU & Memory' is passed from the dashboard, or it will always be empty.
 4.Fellow the logic of step 3 and create 3 more reports. Each one is hard coded with a different group name value: "Top Node Interface", "Top Node LSP", "Top Node Pseudowire":


5. Put everything together on the dashboard along with all the other reports and prompts that already exist there:


Notice on the dashboard layout edit page I have put all of the reports into different sections, yet all of the sections are within 1 column. Each section can be defined using conditions to determine whether it displays or not. This can have different visual affects depending on how you arrange it.

So in my case, I have taken the first section and added a condition using 1 of the 4 new reports just created. In this case, the node report selection guide1, which is using value  'Node CPU & Memory' is being picked as a condition for this section. Because the 2 reports in this section are relevant to the topic and I want them to be displayed only when user selects 'Node CPU & Memory' from the dashboard prompt.


I then apply the same logic to all the other sections using different reports I created.

6. Test the new look:

In this dashboard you can see that initially there is nothing being processed. I do have a few prompt values as default. And if you see the dropdown box of my new prompt, it gives user 4 items to select.


User select 'Top Node Interface' and click apply, then the dashboard displays only the reports grouped under this name. This is done without popping a new windows nor taking you to another page. It happens right in front of you:


You notice that not only the correct report is showing, but also the values from the other prompts default are also being filtered at the same time. Cool..

Now try a different item just to be sure. This time I pick 'Top Node LSP' as shown:


Click apply and I get a new report:


Things are working and now my dashboard has a new life although not quite looks like the weather view on Iphone, but it's still pretty slick. Maybe the spirit of Apple awakens the artsy side of me just for the moment.

Thanks

Until next time.

How to build a report that accurately reflects data corresponding to different local times from different time zone --Part 1

$
0
0
Previously,  I have concluded my approach to implement the reports that will intelligently retrieve data corresponds to different time zone even if the displayed time stamp never changes. In other words, when any user changes its account setting to a different time zone, the report should automatically displays the data accordingly even if the values displayed on the dashboard prompt is still "Jan 01, 2001" for instance. The meaning of the report, the displayed time changes completely when the account setting changes. This wasn't easy but it was proven possible.

However, there was an issue with the report I created if you really test it deeply. Let me demonstrate here:


We have the following report that shows date, hour, hour number and the throughput. Each throughput has a corresponding time which is from the Date Dim table. It is a simple report and the time zone setting is default. So nothing fancy here.


Now, let's change the time zone to GMT + 8 Perth time and rerun the report:

As you can see below, the displayed time zone local time has changed to reflect Perth time while hour, hour date and hour number are still reflecting the default time. This issue has been mentioned previously. This is the behavior of OBIEE, it only changes the display of the time stamp based on locale time zone, it doesn't really do the actual time stamp conversion. Therefore, when you convert time stamp to hour number, it is converting the time stamp from "Hour Date" column, rather than "Hour Date Time Zone Local Time" column. Hence the confusion.


So let's change the hour filter to 10 to 12, the report comes back with correct data. How so?

Well, the user wants to know the throughput of 10am to 12pm on Jan 6th 2013 Perth time, and the report is showing these 3 throughput records of 2am to 4am, Jan 06 2013 UTC time. That's why it is good.


Now let's change the filter to between 1 to 3 and rerun it.

Then we are having problem. Because now, the user wants to see the throughput of 1am to 3am Jan 6th 2013 Perth Time, yet the report is displaying the data 5pm to 7pm Jan 6th 2013 UTC. This is wrong. It should've displayed the throughput of around 5pm to 7pm Jan 5th 2013 (the day before).


Now we know there is an issue, but how are we going about it?

Before doing anything, I need to understand how is the conversion taking place and how am I filtering the report. So I then created some dummy columns in the same report with different expression to understand what kind of behavior it is doing for this particular time zone (when Offset value = 8).

Hour date: This is nothing but hour date - 8. This will return the time stamp of the default UTC because the display of hour date is going to be plus 8.

Hour number: This column will give the hour number according to UTC time stamp

Conversation Hour Number: Here I am doing a time stamp plus 16 hours. This will give me the hour number in accordance with the Displayed Perth Time Stamp. It took me a while to figure out it is 8*2. If the offset is 4, then it should be 4*5 to get you the right hour number that matches the display.

Run the report and see what its doing:


So we see the problem with this column. Since the filter on date is Jan 6th 2013, we are getting all of the records of Jan 6th 2013 of UTC time. Therefore, the displayed local time in this case is missing 0 to 7 on the same date, and its adding 0 to 7 of the next date. This is expected behavior.

With the same logic, if I change the local to GMT -8, or Pacific Time in U.S.A, this behavior should occur the same way in reverse as shown:


My first approach is to find a way to convert this hour so it will match the displayed local time stamp both hourly and daily. Without thinking too much, I added "hour(Date, "Hour Date") +@{Offset}" to the expression and named the new column "Hour number with offset" and rerun the report for both +8 and -8 time zone:


Perth Time, +8 to UTC:

Pacific Time, -8 to UTC:


See what's going on? Looking at both cases, the conversion is giving the correct hour number from 0 to 23. However, when the result exceeds 23 (in the case of +8 time zone when adding 16 (UTC hour) with 8), it becomes 24 and it keeps going on with 8 more numbers by increment of 1; when the result is less than 0 (In the case of -8 time zone when adding 0 (UTC hour) with -8), it becomes -8 and it keeps going on with 8 more numbers by increment of 1.

I am close, but not quite there yet. I have realized that I need to do some programming and address the case of less than 0 and greater than 23. Luckily, I have found a good solution and it is working perfect. I will continue here.

Stay tune!

HOW TO BUILD A REPORT THAT ACCURATELY REFLECTS DATA CORRESPONDING TO DIFFERENT LOCAL TIMES FROM DIFFERENT TIME ZONE --PART 2

$
0
0
Previously, I have stated the issue when it comes to reporting based on different time zone hours, now continue on what the solution I have found.

As previously mentioned "the conversion is giving the correct hour number from 0 to 23. However, when the result exceeds 23 (in the case of +8 time zone when adding 16 (UTC hour) with 8), it becomes 24 and it keeps going on with 8 more numbers by increment of 1; when the result is less than 0 (In the case of -8 time zone when adding 0 (UTC hour) with -8), it becomes -8 and it keeps going on with 8 more numbers by increment of 1."

So I have to add some conditions to take care of both cases when the number exceeds 23 and when it is less than 0.

As an experiment, I created one more column named 'hour conversion' with the following formula:

case when (hour(Date."Hour Date") + @{Offset}) < 0 then hour(TIMESTAMPADD(SQL_TSI_Hour, @{Offset}, Date."Hour Date" )) when (hour(Date."Hour Date") + @{Offset}) > 23 then hour(TIMESTAMPADD(SQL_TSI_Hour, @{Offset}, Date."Hour Date" )) else (hour(Date."Hour Date") + @{Offset}) end

The idea is that, when the converted time stamp is less than 0 and greater than 23, we want to display the converted time stamps in hour number, else, just the time stamp itself as it is in terms of hour number:


Now after done that, I have to create some filters on the report. The filter is going to base on the content of the formula defined in this column.

So, create a set of filter on date and "hour conversion" column:


1. cast(Timestampadd(SQL_TSI_HOUR, @{(Offset}, Date, "Hour Date") as date) is between date from the prompt ---- Here, I first convert the time stamp with Offset value, then convert it to date. Then use this to filter against the date values that user pass through the prompt.

2. case when (hour(Date."Hour Date") + @{Offset}) < 0 then hour(TIMESTAMPADD(SQL_TSI_Hour, @{Offset}, Date."Hour Date" )) when (hour(Date."Hour Date") + @{Offset}) > 23 then hour(TIMESTAMPADD(SQL_TSI_Hour, @{Offset}, Date."Hour Date" )) else (hour(Date."Hour Date") + @{Offset}) end is between the hours from the prompt --------- Here, basically whatever value that's converted by the formula in "Hour Conversion" column that I created will be compared against the hour number that user passes through the prompt:


Now, let's test it out:

This time, the time zone is UTC + 8 (Offset = 8).

As you can see, Hour Conversion field is showing the hour numbers matching Time Zone Local Time, the Hour Day Date column on the far right is matching the date as well


It works just as well with UTC -8 Time Zone


Now, let's change the filter hour to 1 to 3 and test again:

It is correct:

Remember the incorrect report from part 1 of this series? Now, let's compare that report with the new one and see the difference:


So, now I can confidently say that my report is going to give you the correct data at your local time based on whatever hourly criteria you want.

Thanks

Until next time

OBIEE Lessons learned ---- How to design the data modeling and schema based on requirements

$
0
0
Hello

As you have worked in various OBIEE projects, you probably will have encountered different data models for different business. Oracle has implemented their own BI Apps which contains pre-built schema as well. Unless you started the project from ground zero, chances are your project will already have a list of tables created as you walk in to the project. Looking into all these dimensions and facts or cubes, you will probably be told what was going on before and how to move forward from that. However, little did you know the mind of the person who decided on this list of objects nor did you know his understanding of the requirement. You will probably use your technical backgrounds to build the application based on what's already there.

Some of the designs are really good and some of the designs have limitations. Nonetheless, they all come from trials and errors over and over, and the way they are is probably where they concluded to be the most suitable design at the time. So today, I want to just go over something I learned over the years in terms of how to decide the data model based on the understanding of the requirement. This involves a lot of considerations from a holistic perspective.

Look at the below diagram:


This is a very simple requirement. I want to create a report that shows me all of the entity As in my system, as well as the entity Bs and Cs that each A associates with at any point in time. I may also want to see the counts of Bs and Cs that each As have.

Simple enough right?

So we have the keys, we create a report that joins all of the these 3 entities. Great, job's done. However, the problem comes when you want to look at the report at a specific time. Why is that a problem?

Well, Lets say entity A doesn't change very often. It could be your local retail branch that once it's opened, it will stay active for a while. Or it could be geographical area or sales territory that won't change unless the business change. Entity B changes more often than A, it may change once a day. So it could be some kind of account status, or in network industry, it could be router or Pseudowire configuration data. And entity C may change hourly, this could be certain business transaction, market indicators or it could be the wireless signals that travels through the area. What if I want to see the information of all my As as well as how many Bs and Cs (in counts) that each As have on Jan 1st 2013 between 3pm to 4pm?

The problem comes that, since all of the As are active, they should  be expected to be shown on the list. At this particular hour, not all of the As are associated to any Bs and Cs, their counts should be displayed 0. However, in this particular report, it is not going to happen. Only the As that it's keys are found matching the keys in Bs will return at the particular time, same as for C counts. All of the sudden, users will be scratching their head while looking at this report wondering where are all the other As, because they know they have them in the system..

Let me show you another problem. What if Bs get updated once a day at 12am, then the time key from date dimension will only match when your hour filter is set at 12am for the report to return anything because the time key in your B dimension probably looks like this "201301010000" (for 2013 Jan 1st 12am) and then "201301020000". The only way to query this table without filtering out data is to join B dimension at date level by not looking at the hours. However, what if later on when the business needs to change the data collection frequency from once a day to 4 times a day?

There can be many other issues when it comes to time sensitive information. So knowing all these (trust me, sometimes you wouldn't see the problem unless it hit you, then it could be a big mess!), what should I do?

Seeing that there is a clear hierarchical relationship between these entities (or sometimes there might not be a straightforward hierarchy), we need to find a way to have super set of the data that are pre-computed with all of the entities.

This is where an aggregated fact table should be designed. Imagine there is a table, it is pertaining to entity A, so in this table, all of the As in the system will be preloaded based on it's update frequency. For each As, we will find the associated B keys. Then we have a few columns, like number of Bs, number Cs where the counts of Bs and Cs will be populated hourly. Ideally, you will have each A repeated 24 times per date, on each hours it will show the counts because hour is the granularity of the report. Now you have to be careful, because once you start denormalizing the table, it can result in huge data-sets. We want to really be careful about how many levels of hierarchy you want to report here. Depending on the nature of the business and the data from each entity, only maintain the dimension keys in this table as long as it doesn't expend the data set into too huge volume. 

So let's say the nature of the hierarchy is like the following:


In this case, if we put C keys and B keys both into the same aggregate fact table, we might create a huge data set, which we have to be careful about. One option will be breaking this own diagram into smaller areas for reporting.

You can have 1 table that have keys of As and Bs and another for Bs and Cs. In terms of designing the display of the data, you can always go from summary to detail or from high level to lower level. Kind of like the level 1 and level 2 report shown there. This will be a good reference for deciding how many of these pre-computed tables that needs to be create or how to design the granularity of your fact table, it also determines the update frequency of this table.

Oracle has another option for dealing with this kind of requirement, it is called materialized views. Implementing materialized views can provide many benefits, however, it also can come with some drawbacks. Therefore, it needs to be looked at case by case. The idea, though, is similar.

If you look at the BI Apps and many other out of the box schema from OBIEE product, you will see similar things being implemented. There could be many other reasons for that. Knowing the reason, knowing the pros and cons of the data modeling will eventually sets you apart from others who only takes what's been done and run with it.

Thanks, until next time.


Summary: How to create BI platform that globalizes reports across all time zones

$
0
0
So after all of the trials and errors, understanding of the complexity and trickiness of globalizing (or internationalizing) reports across all time zones, I am going to summarize all of the steps in this entry.

First of all, let me go over the requirements and issues once again when it comes to this type of reports. In the nutshell, the requirement is simply to answer the question of what happen to my business at this particular time in my local time zone.

In other words, my stock is trading in New York and I want to know what is the stock price at 3pm California time. Or, my account is in Europe, I want to know all of the transactions at 2am Tokyo time. Even, what is the average trade volume of this stock from 10am to 1pm my local time in Berlin for the stock being traded in London. For the particular project that this requirement is applied to, I want to know all of the signal drops in my telecom network from 8am to 9am Greenwich mean time, or show me all of the interfaces that exceeds the throughput from 8am to 9am my local time.

Traditionally, the data are typically managed at the ETL layer and the data source feeds data with their local time zone.

Below is the approach I used:


1. Enable OBIEE's time zone setting by editing the instanceconfig.xml file
Detail can be found in this article


2: Store all of the data at standard UTC time in the DB. Then create a DB table that stores all of the time zones and offset hours there for OBIEE to report against. The offset value is then available for used as presentation variable from OBIEE dashboard. These steps can be seen in this article

3. Apply the conversion using the offset values obtained from step 2 to the date and timestamp fields of the report. Depending on how the logic is, your formula maybe different. This article explains how this is applied in my case.


So, that's all there is to it.

Now one shortcoming of this approach is that the day light saving conversion will have to be done manually by updating the external table's offset column. Potentially, a function or SP maybe used to automate the process. However, day light saving is a very complicated thing by its nature, different country have different laws on when it is changed. There is no way around it. This is something we will just have to get used to it.

Thanks,

Until next time.

Starting OBIEE 11G Service Components --- For Server bi_server1, Node Manager Associated with Machine not reachable

$
0
0
Hello again.

So I have installed OBIEE 11G, now what do I do to bring everything up so I can log in and see the 11G dashboards?

I am assuming you have the basic understand of OBIEE 11G architecture, or at least you know the relationship between weblogic and BI Components. So from there, the first time we do is to start the weblogic services.

Take my Linux environment for instance, you navigate to the following directory and run the weblogic start script:

/MWhome/user_projects/domains/bifoundation_domain/bin/startWebLogic.sh

Having done that, you should be able to log in to the UI of Console and EM.

Once I am in, I am trying to start the bi_server1, yet I run into the following error:

For Server bi_server1, Node Manager Associated with Machine not reachable


This tells me that I need to make sure the node manager is up and running.  This time, I navigate to the following the directory where node manager script is located:


MWhome/wlserver_10.3/server/bin/startNodeManager.sh

Upon running the script, I encounter the following error:


This indicates that I have to see whether the port number that Node Manager is configured is used or not. By default, the port number is 5556, however in our environment, it was 9556. So do the following:


Here it shows that for 9556, there is 4642 that is running, so we need to kill it:


After doing that, we need to run the SetWLSenv script, this will set the environment for weblogic, after that, we re-run the node manager start up script:


After that, we resume the bi_server1 and now it is successful:


Next, we move on to the EM interfaces and start the BI components. But before doing that, we need to start the OPMN by going to the following directory:

/oracle/product/middleware/instances/instance1/bin/opmnctl

And run the opmnctl script:


After that, start all of the BI Components in EM UI:


Thanks

Until next time.

Install OBIEE 11G on Linux part 1

$
0
0
Hello

Today I want to talk about the detail process that I went through to install OBIEE 11G and setting up the entire OBIEE development environment. In my case, I was given a Linux machine and told that I was free to do anything with it as long as I install OBIEE 11G there and use it as development environment.

Doing it from scratch forced me to evaluate everything about the environment, so let me start by going over the prerequisites that my machine needs to have before doing the installation.

1. Depending on the OS versions, OBIEE might require certain library files. The missing files will be informed during the initial environment check when installing OBIEE. Moreover, OBIEE 11G needs to connect to the Database. In my case, we are using Oracle DB. So 2 scenarios are presented:

A: If installing 11g on the same machine where Oracle DB is installed, then it the DB and Oracle DB Client tools should already be there.

B: If installing 11g on a different machine and intend to connect remotely to the DB Machine, then Oracle DB Client is needed. Also, RCU needs to be ran on that machine as well because chances are, the sysdba user of that DB Machine is not accessible directly from this machine.

If using other DB, please check the requirements

2.  Add the following lines into /etc/security/limits.conf
*           hard                nofile              10240
*           soft                  nofile              10240


Test it as root user to verify ulimit setting

3. Download and move all of the OBIEE 11G files as well as RCU zip files to the Linux machine and unzip them:

Unzipping RCU files:


Unzipping OBIEE 11G files:

4. The RCU and the 11G installation are done through a windows UI, therefore the displaying of it in Linux or Unix environment needs to be set up by configuring the $Display environment variable. In my case, things are done by accessing Linux through VNCviewer and the display is set at 4:


Now ready to run RCU:


Continuing on to the next entry

Stay tuned!

Install OBIEE 11G on Linux part 2 --- Installing RCU

$
0
0
From the previous entry, we have covered all of the prerequisites and getting the system fully ready, the only thing missing from there was pressing the button. So now, let's press that button and kick off RCU.

Because the 11G architecture is different, before the actual installation of 11G, repository and schema need to be created and by referenced later during the 11G installation, therefore this step must be done before 11G installation.

1. First page of the RCU

2. After clicking 'Next':


3. Next page is to check Prerequisites as well as entering the SYSDBA account credentials that is required to connect to the Database (system/manager in my case). Please read the previous article to understand what the requirements. Without selecting SYSDBA as role, the installation will fail later. If this machine doesn't have the DB, then the same RCU needs to be run on that machine as well.

4. Prerequisites met:


5. Create passwords for the schema we are about to create here. This information will be used later during 11g installation:


6. Map table space;


7. Summary of what has happened so far:


8. Creation process completion


That is it. Now we are ready to install OBIEE 11G

Stay tuned for the next entry

Install OBIEE 11G on Linux part 3 --- Installing OBIEE 11G

$
0
0
Previously RCU has been run and completed, now it's time to install OBIEE 11G. Oh, I forgot to mention that the version I am installing is 11.1.1.6.0, which is pretty buggy.

Remember those 3 disks or 5 zip files we unzipped into 'bishiphome' folder? We will go there (under Disk1) and run the installer file to launch the installation wizard:


Here are the rest of the steps:

1. Choose Enterprise Install:

2. Checking prerequisites and passing:


3.  Create the username/password, this will later be used to log in to weblogic consoles and EM interface:


4. Choose the location where OBIEE 11G will be installed:


5. Next screen, just click all of them:


6. Now we need to refer the schema created from RCU process done previously:

What I entered in my case:


7. Next screen. Just choose Auto Port Configuration


8. Security update option comes next. I usually skip this, you can feel free to subscript to this option as you wish


9. Summary of all of the setting we have done so far:


10. Upon clicking 'Install', the process kicks off:


11. Final Completion:


This is the whole process of installing OBIEE 11g. Upon successful installation, the weblogic server, node manager and BI Components are automatically in running state. You can immediately log in (username/password will be what you created in step 3) to your 11g front end interface. By default, what you will get the sample demo dashboards and reports until you start creating your own or start upgrading your 10g stuffs.

Next time, we will talk about applying patches for this version of 11g.

Stay tuned


Viewing all 60 articles
Browse latest View live


Latest Images